Project Overview


Project Type:
Role
Project Outcome
Hackathon- Machine Learning Classifier for Passenger Satisfaction Prediction on Shinkansen Bullet Train.
Data Scientist / Machine Learning Engineer
Developed a machine learning model to predict whether a passenger was satisfied or not with their overall travel experience on the Shinkansen Bullet Train as part of a hackathon challenge. Achieved high accuracy by utilizing ensemble methods and parameter tuning, and provided key insights into factors affecting passenger satisfaction.
Methods
1. Exploratory Data Analysis (EDA): Investigated data distribution, relationships between variables, and missing values.
2. Data Preprocessing: Imputed missing values, applied label encoding, handled class imbalance using SMOTE.
3. Machine Learning Models: Decision Trees, Random Forest, AdaBoost, Gradient Boosting, Logistic Regression, SVC, Bagging Classifier, GaussianNB.
4. Hyperparameter Tuning: Used GridSearchCV to optimize models (Random Forest and AdaBoost) for better generalization.
5. Ensemble Voting Classifier: Combined the best-performing models (Random Forest and AdaBoost) for optimal predictions.
Deliverables
1. A predictive model to classify passenger satisfaction.
2. Expected to deliver a highly accurate model and a comprehensive analysis of passenger satisfaction factors.
3. Ranked 16th for building an accurate and robust model
Tools
Python, Pandas, NumPy, Scikit-learn, Seaborn, Matplotlib, Decision Trees, Random Forest, AdaBoost, Gradient Boosting, Bagging, GaussianNB, Logistic Regression, SVC, SMOTE, GridSearchCV and Google Colab.
Context
The Shinkansen Bullet Train Experience:
The Shinkansen Bullet Train is one of Japan’s most popular and efficient modes of transportation. To improve the passenger experience, understanding the factors influencing overall satisfaction is crucial for service providers. By analyzing travel-related data alongside survey feedback, there is an opportunity to predict passenger satisfaction based on various travel parameters such as seat comfort, catering, and onboard services like Wi-Fi. This project, conducted as part of a hackathon, aims to identify which factors most strongly impact passenger satisfaction, providing actionable insights for service improvement.
Objective
The primary objective of this project is to develop a machine learning model that can accurately predict whether a passenger was satisfied or not with their travel experience on the Shinkansen Bullet Train. The model will be trained on survey and travel data, and the key goal is to identify the most influential factors that lead to positive passenger experiences. In addition, the model should provide high predictive accuracy, while the insights derived from it should help service providers enhance overall customer satisfaction and optimize their offerings.
Key Research Questions
-
What are the most important factors influencing passenger satisfaction on the Shinkansen Bullet Train?
-
Can a machine learning model accurately predict whether a passenger is satisfied or not based on travel and survey data?
-
How does the on-time performance of the train influence passenger satisfaction
-
Which demographic or travel-specific factors (age, type of travel, seat class) have the strongest correlation with satisfaction levels?
-
What are the key differences between satisfied and unsatisfied passengers based on their feedback on service aspects such as catering, seat comfort, and onboard facilities?
PHASES OF PROJECT
This Shinkansen Train Experience project progressed through six phases: Data Discovery, Data Preparation, Model Planning, Model Building, Communicating Results, and Operationalizing the system for real-world use. Each phase was crucial in developing and optimizing the recommendation model.

Data Discovery
Goal:
Identify and gather relevant data to build the music recommendation system.

Data Preparation
Goal:
Clean and prepare the data for further analysis.

Model Planning
Goal:
Decide on the most appropriate algorithm to build the recommendation system.

Model Building
Goal:
Develop and train the recommendation model.

Communicating Results
Goal:
Present the model’s performance and insights to stakeholders.

Operationalize
Goal:
Deploy the model in a real-world environment and monitor its performance.
Phase-1

Data Discovery
1 / Datasets:
Loaded both Travel Data and Survey Data to understand the scope of the data and identify missing values.
2 / Initial Data exploration
1. Key variables such as Age, Type_Travel, and Arrival_Delay_in_Mins had missing data, which required imputation.
2. Dropped unnecessary columns like ID, while categorical columns were flagged for transformation.
Key Insights
-
Some features, such as Seat_Comfort, Catering, and Onboard_Wifi_Service, appeared to have a direct relationship with overall satisfaction, while other features, such as arrival delays, played a less significant role.
Challenges
-
Handling missing data and preparing categorical variables for model consumption was a key task.
Data Preparation
Phase-2
1 / Imputation:
-
Missing values were handled by filling in the most frequent or median values to ensure the dataset was complete.
2 / Label Encoding:
-
Ordinal categories like Seat_Comfort, Catering, Onboard_Wifi_Service, and other similar service-related variables were replaced with numeric values to preserve their order.
-
Categorical variables such as were also encoded into numeric values for model compatibility. For instance, Gender was encoded as 0 for Female and 1 for Male.
-
The Age column was converted to a categorical type and transformed into dummy variables (one-hot encoded), splitting the Age into separate binary columns like Age_25, Age_35, etc., to represent age groups.
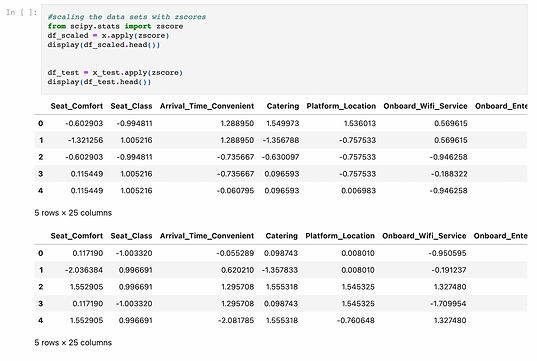
3 / Z-score Normalization:
-
To standardize the data for better model performance, all features were scaled using Z-scores. This method normalized the data, ensuring all features have a mean of 0 and a standard deviation of 1.
Key Insights
-
By encoding ordinal and categorical features using meaningful numeric values, the model was able to better interpret the relationship between service quality and passenger satisfaction.
-
Standardizing the dataset using Z-scores helped to improve model convergence and performance, particularly for algorithms sensitive to feature scaling.
Challenges
-
Encoding a wide range of service-related variables, while maintaining their ordinal significance (i.e., ensuring "Excellent" is better than "Good"), required careful attention. This ensured that the models accurately captured the impact of these variables on passenger satisfaction.
-
Careful attention was required during scaling to ensure that ordinal features retained their original rank order, and scaling was applied consistently across both training and test datasets.
Phase-3
1 / Process:
Model Selection Strategy:
-
Tree-based Models: Decision Tree and Random Forest were selected due to their ability to capture complex, non-linear interactions between features. Their feature importance scores would also provide valuable insights into the key drivers of satisfaction.
-
Ensemble Methods: Bagging, AdaBoost, and Gradient Boosting were planned to enhance model robustness by combining multiple weak learners. These methods were expected to reduce overfitting and handle noisy data effectively.
-
Linear Models: Logistic Regression and SVC were chosen to provide a baseline for performance comparison against the tree-based and ensemble models. These models would help test the linearity of the relationships in the dataset.
Key Parameters for Exploration:
-
For tree-based models: Parameters such as max_depth, n_estimators, and min_samples_split were identified as critical for model performance.
-
For boosting algorithms: Parameters like learning_rate and n_estimators were planned for tuning to balance model complexity and accuracy.
Trial Approach:
-
Initial testing of each model was planned to be done with default parameters, followed by GridSearchCV for hyperparameter optimization. The performance of the models would be measured using accuracy and confusion matrices, along with cross-validation to assess generalization.

Model Planning
Key Insights
-
Ensemble Methods were expected to outperform simpler models due to their ability to handle complex interactions between variables and reduce overfitting.
-
Tree-based Models would likely provide important insights into the key features influencing satisfaction, thanks to their feature importance metrics.
Challenges
-
Tuning Complexity: Finding the optimal balance between underfitting and overfitting was expected to be challenging, particularly for ensemble methods where parameters like n_estimators and learning_rate could significantly affect model performance

Model Building

Decision Tree Classifier: dTree,dTree1 Random Forest Classifier:rf,rf1 Bagging Classifier:bgg,bgg1 AdaBoost Classifier:ada1,ada2 Gradient Boosting Classifier, Logistic Regression:lr,lr1, Gaussian Naive Bayes (gb),

ada1, rf1 and rf are the three best models with accuracy of 95.4, 95.3 and 95% respectively.

Votting with the best models Accuracy: 0.9986755493159212, 0.9526912481457936
Decision Tree Classifier: dTree,dTree1 Random Forest Classifier:rf,rf1 Bagging Classifier:bgg,bgg1 AdaBoost Classifier:ada1,ada2 Gradient Boosting Classifier, Logistic Regression:lr,lr1, Gaussian Naive Bayes (gb),
Model Building Snapshots
4 / Voting Classifier:
A Voting Classifier was employed to combine the strongest models, Random Forest and AdaBoost, leveraging their complementary strengths for better predictions.
5 / Hyperparameter Tuning:
1. GridSearchCV was used for optimizing Random Forest and AdaBoost with parameters like n_estimators, learning_rate, and max_depth.
2. Trial and error tuning for SVC and Gradient Boosting refined key parameters such as gamma and C.
Phase-4
1 / Decision Tree and Random Forest:
Two Decision Trees and Random Forest models were built to capture complex patterns, with variations in max_depth, min_samples_split, and n_estimators for better performance.
2 / Bagging and AdaBoost:
1. A basic Bagging model was constructed, followed by a more advanced Bagging Classifier using Decision Trees as the base estimator.
2. AdaBoost was tested with both Random Forest and Decision Tree as base estimators, evaluating boosting techniques for better robustness.
3 / Gradient Boosting and Logistic Regression:
Gradient Boosting and Logistic Regression were applied as baseline models, providing a comparison between boosting techniques and simpler linear models.
Key Insights
-
Ensemble Methods like Random Forest and AdaBoost demonstrated superior performance, particularly when combined in a Voting Classifier. This ensured more balanced and accurate predictions.
-
Hyperparameter tuning through methods like GridSearchCV significantly improved model generalization, especially with complex models.
Challenges
-
Training Time: Parameter tuning for ensemble methods, especially AdaBoost and Random Forest, increased computational time significantly due to multiple iterations.
-
Overfitting: Managing overfitting was a challenge, especially for deep models. However, careful tuning of parameters like min_samples_split and learning_rate helped mitigate this risk.
Phase-5
1 / Process:
-
AdaBoost Model (ada1): Predictions were made using AdaBoost, achieving an accuracy of 95.1%. The results were saved as sample_1.csv.
-
Random Forest with GridSearchCV: A fine-tuned Random Forest model generated predictions, saved in sample_3.csv.
-
Random Forest with Probability Adjustment: Using predict_proba(), passengers with a probability over 0.47 were classified as satisfied. These predictions were saved in sample_5.csv.
Communicating Results
Key Insights
-
AdaBoost achieved the highest accuracy of 95.1%, while Random Forest models provided flexible options for tuning and threshold adjustment to refine predictions.
Phase-6
1 / Business Recommendation:
-
Implementation Plan: Although this was a theoretical project, an implementation plan would involve deploying the model to predict customer satisfaction in real-time based on survey responses.
-
Future Considerations: Regular monitoring of the model’s performance would be necessary to ensure that the model continues to provide accurate predictions as customer behavior and service quality evolve over time.
Operationalization
Key Insights
-
The model could be used to continuously assess customer satisfaction and adjust services to improve customer experiences.
Challenges
-
Ensuring the model remains accurate over time and is integrated into a real-time system would require constant updates and monitoring.
Reflection
Participating in this hackathon was not only a challenging experience but also a ton of fun! Competing alongside talented data scientists, I pushed my machine learning skills to the limit. My AdaBoost model, which clocked in with a 95.1% accuracy, helped me secure a 16th rank in the competition.
From tweaking hyperparameters to adjusting thresholds, it felt like solving an intricate puzzle, where every small change could make a big difference. The pressure of fine-tuning models like Random Forest and AdaBoost in real-time was exhilarating. And yes, there were moments when it felt like I was wrestling with my CPU more than the dataset—but that’s all part of the hackathon thrill, right?